Evaluating Text-to-SPARQL Agents: Execution Accuracy, Coverage, and the Noise Floor
How do you compare LLMs on generating structured queries? Syntax similarity is worthless. What works: executing generated queries against a live triplestore and comparing result sets — plus a spread rule most benchmarks ignore.
 Teo ParashkevovPublished5 min read
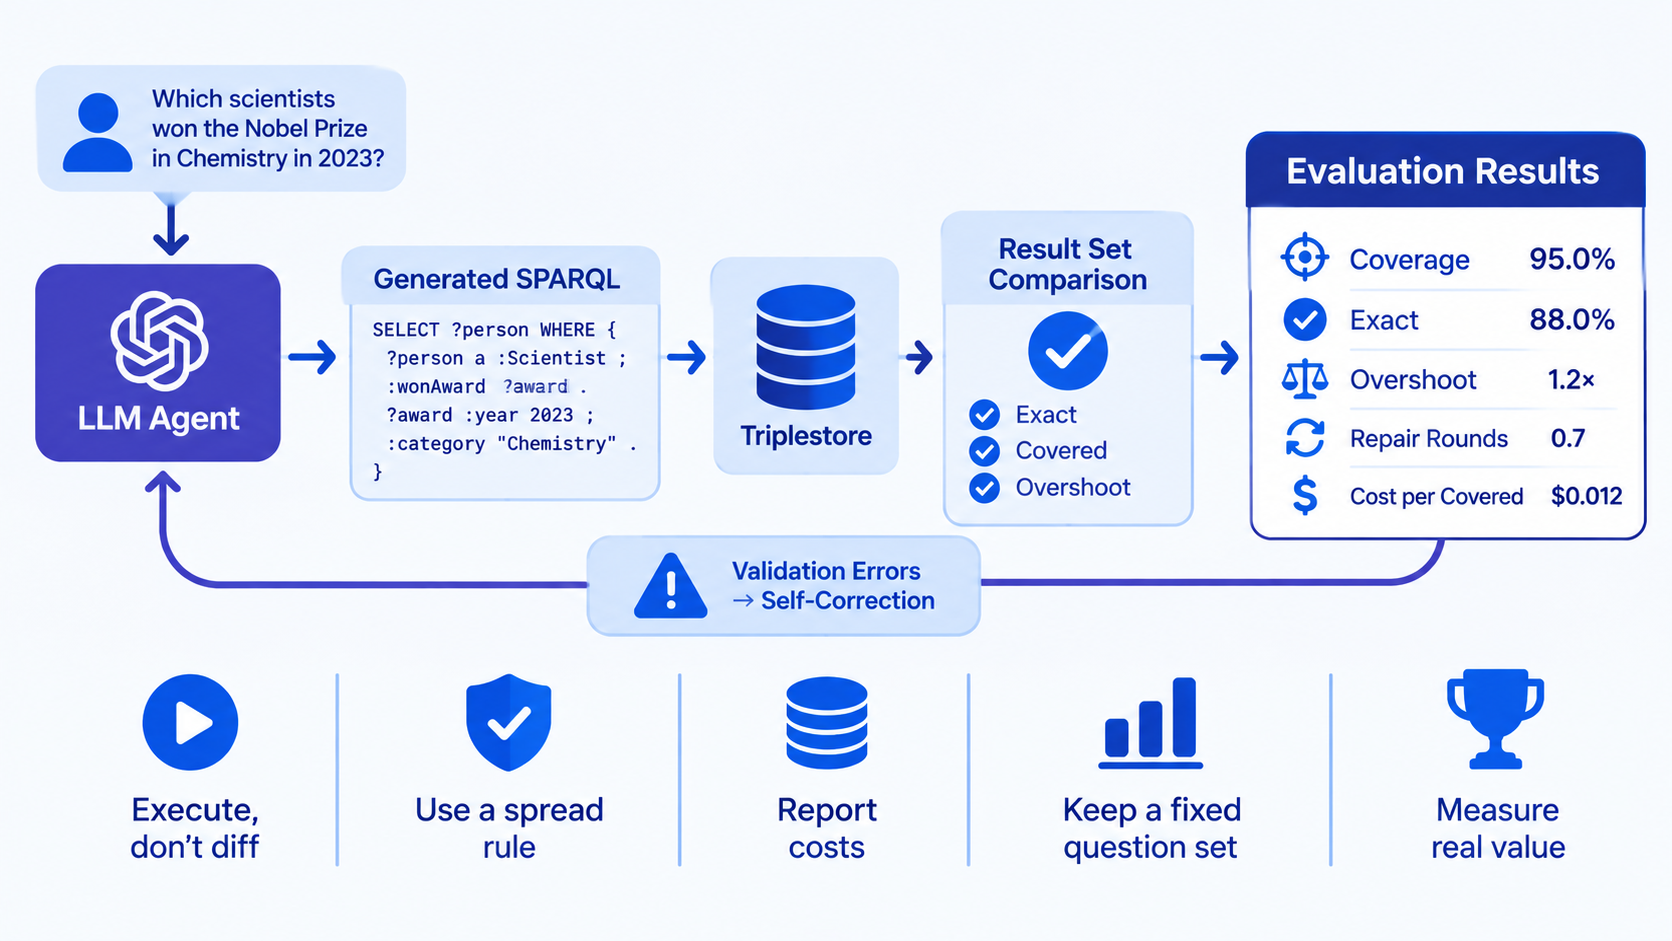
“Which model is best at generating SPARQL from natural language?” — answering this well requires deciding what “best” means, and the obvious answer (does the generated query look like the gold query?) is worthless. A query can be syntactically near-identical and semantically wrong; it can look nothing alike and return the exact right rows. This post lays out an evaluation methodology built on execution rather than syntax, the metrics that survive contact with reality, and a statistical rule that most benchmark write-ups skip.
Execute, don’t diff
The core decision: generated queries run against a live triplestore, and the result set is compared to the gold query’s result set. Syntax contributes nothing. Two consequences follow:
- Order-insensitive, name-insensitive comparison. SPARQL result sets are unordered by specification; a query returning the same rows in a different order is correct. Variable names are the model’s free choice —
?personvs?whoare the same query. Comparison keys on row content under some column pairing. - The metric hierarchy must be honest about what it measures:
| Metric | Definition | What it tells you |
|---|---|---|
| Exact | Same rows with same multiplicities, under some column pairing | Strict lower bound — correct schema and correct content |
| Covered | Candidate retrieved every value the gold retrieved | “Did the user get the information they needed?” — the primary metric |
| Overshoot | Median ratio of distinct candidate values to distinct gold values | Precision-flavored: retrieving everything is not success |
| Repair rounds | Mean iterations of feedback-regenerate per question | Efficiency: how much scaffolding the model needs |
| Ran out of tool calls | Count of questions exhausting the agent budget | Hard failures |
Coverage is the headline metric because it answers the user’s actual question. A model whose query misses the gold’s column pairing (an arity mismatch — by far the most common exact-failure shape: the model picked different SELECT variables) still covered the need if the right values appear anywhere in its result. Exact is the lower bound; covered is the report card; overshoot keeps a “return ?s ?p ?o for everything” cheater from winning — coverage is refused outright beyond a 5× volume ratio.
The harness
Each model profile runs the same N-question benchmark. Per question, the harness records: generated queries, final answer, exact/covered verdicts, row and distinct-value counts on both sides, the match reason when wrong, repair round count, latency to first token, total seconds, token counts (input/output/reasoning), and derived cost. Questions are categorized so per-category tables expose where a model actually loses:
- simple-lookup — direct triple match
- multi-hop — traverse several relations
- temporal — sequences, ordering, time series
- aggregation — grouping and aggregates
- named-graph —
GRAPHclauses, named datasets
A model that’s brilliant on lookups and hopeless on temporal joins is a different product decision than one that’s uniformly mediocre.
Determinism: control it or confess it
temperature=0 plus a fixed seed makes most models deterministic at the settings level — meaning repeated runs differ only in infrastructure nondeterminism, which is measurable. Two rules:
- Apply temperature and seed uniformly across all profiles, or your comparison measures sampling luck, not capability.
- Some frontier models accept neither parameter (fixed temperature, no seed support). They get a single-sample run — and the write-up must say so plainly. A non-repeatable profile is still a data point; pretending it’s repeatable is a benchmark integrity failure.
The spread rule: a difference smaller than the noise is not a difference
Here’s the part most evaluations skip. Run every model 3 times and record covered-count per run. Each profile now has a spread — best run minus worst run:
Model A: covered 24 / 17 / 26  → spread = 9 questions (22.5 pts)
Model B: covered 32 / 31 / 30  → spread = 2 questions (5.0 pts)
Two profiles 6 points apart on their means are not meaningfully different if either profile’s own run-to-run spread is larger than 6. The decision rule: a difference between two profiles smaller than their spreads is not a difference. This sounds obvious; it is violated constantly, usually by running everything once and ranking the resulting single sample.
Spread is itself signal worth reading. Model A’s 22.5-point spread means its answers are a lottery on any given day — operationally, you must assume the worst run. Model B’s 5-point spread is a dependable floor. For production selection, a lower-spread model at slightly lower mean often beats a higher-mean lottery.
There’s also a per-question dimension: a question answered correctly in 2 of 3 runs is flaky — worth flagging in the dataset itself, because these are usually under-specified questions where reasonable models disagree on intent. Fix the question or accept the ambiguity; don’t average it away.
Costs: the metric that decides in the real world
Covered-per-dollar — cost_usd / (covered ? 1 : 0) aggregated per profile — frequently inverts rankings. A cheap small model covering 70% at a twentieth of the cost wins most production decisions over a frontier model covering 80%. The harness’s per-question token accounting makes this arithmetic honest: input tokens (prompt + retrieved schema), output tokens, reasoning tokens where the API reports them, at the provider’s rate. Record it per question, not just per run — per-run totals hide the questions where repair loops burned 10× the budget.
Question-set discipline
- Keep a fixed gold set with per-question category labels and reference queries, versioned like code. Questions mutate; benchmarks must be reproducible against a specific version.
- Attempted vs. scored: a question the model refused or exhausted on is “attempted but not scored” — track it separately from failures, because refusal and wrong are different product behaviors (a system that says “I don’t know” honestly is safer than one that answers wrong confidently).
- Mutating-query guard: for write-capable endpoints, record whether generated queries were read-only and refuse mutations — both a safety property and a scored dimension.
Takeaways
- Execution accuracy over syntax similarity. Run the query; compare result sets order-insensitively under some column pairing.
- Coverage is the primary metric; exact is the floor; overshoot blocks the return-everything cheat; repair rounds and tool-call exhaustion measure efficiency.
- Control determinism (temperature 0 + fixed seed) or confess its absence in the write-up.
- Run 3× per profile and apply the spread rule: a difference smaller than the spread is not a difference — and spread itself is an operational quality metric.
- Report covered-per-dollar; rankings often invert on cost, and per-question token accounting makes it honest.
- Version the question set, track refusals separately from wrong answers, and guard against mutating queries.
The methodology generalizes beyond SPARQL: text-to-SQL, tool-use agents, code generation — anywhere a model produces an artifact whose value is behavioral, evaluate the behavior. Syntax is what the model shows you; execution is what the user gets.